The last few weeks have brought countless headlines focused on the debt ceiling needing to be raised to avoid a US default on its debt. The potential cascading consequences of default have resulted in market volatility, to say the least.
Understanding the Debt Ceiling
So, what is the debt ceiling? Do I need to be concerned? How does it affect my investment strategy?
The debt ceiling is the maximum the US Treasury can borrow. Increasing this limit requires an act of Congress signed by the President and allows the Treasury to borrow more funds to meet its obligations. The US needs to borrow more since spending continues to far outreach tax revenue even though tax revenue has never been higher.
At our Nation’s founding, Congress had to specifically approve any borrowing to cover expenditures. With WWI and WWII, Congress did not have the capacity to approve every borrowing request, thus the invention of a “debt limit.”
For perspective, since World War II, the debt ceiling needed to be increased 100 times, and 100 times Congress and the President have done so. Seems to be a normal occurrence and is always addressed to avoid a crisis.
In addition, in 1990, the U.S. debt was $4 trillion, and 3.1% of GDP* went towards paying interest on that debt. Today, US debt is at $31.4 trillion. However, only 1.9% of GDP is going towards paying interest on the debt. The debt carry cost is less onerous today than it was in 1990.
Raising the Debt Ceiling and the Impact on Investments
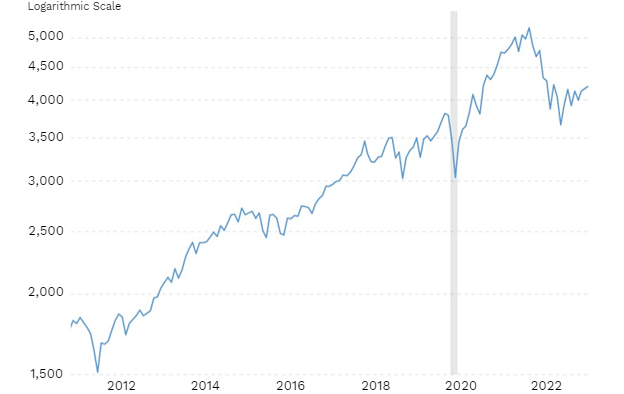
So, what about the effects on the equity markets? The last two times, in 2011 and 2013, when Congressional leaders and the President were at odds leading up to the limit being hit, we witnessed similar volatility and even a sharp decline in the equity markets in 2013 after a deal was made. Should we adjust our investments?
The table below shows the dates when the “crisis” was resolved, the S&P 500 index level at that time, and then the increase since the previous “debt ceiling crisis.”
| Debt Ceiling Crises Resolved | S&P 500 Level | Increase | Annualized |
| 31-Jul-2011 | 1292 | ||
| 17-Oct-2013 | 1733 | 34% | 14% |
| Today | 4206 | 226% | 13% |
Needless to say, this is another reminder to remain goal-focused with your investment strategy instead of event-focused. This shall pass too. Owning a small equity piece of the continuous innovations and advancements generated by companies across the globe remains the best way to protect your purchasing power and lifestyle in the long run.
*GDP – Gross Domestic Product